

In early 2014, we were asked by Denis Zenkin to develop a metric so that we could quickly assess the quality of media coverage generated by PR teams in the countries of Kaspesky Lab’s active presence. By the time, Social Media team was already actively using such a metric which combined varous figures like reach, number of reposts and likes — engagement, and etc. By the time, we already had an analytical agency (Ex LIbris) working for us on monitoring and analyzing the media in Russia and CIS, and they have had a similar experience with Beeline.
So we reached out to Michael Umarov, now running the Comunica agency, who was referred to be the key author of this approach developed at the time when he was doing PR for Beeline. We learned from him the basic concept, studied a bunch of books on marketing and econometrics, and watched a bunch of educational videos on Coursera. Then we sat together with Rainer Bock and Kseniya Volnova, trying to shape the key parameters we need to assess in order to meet our own communication goals.
The result looked like this:
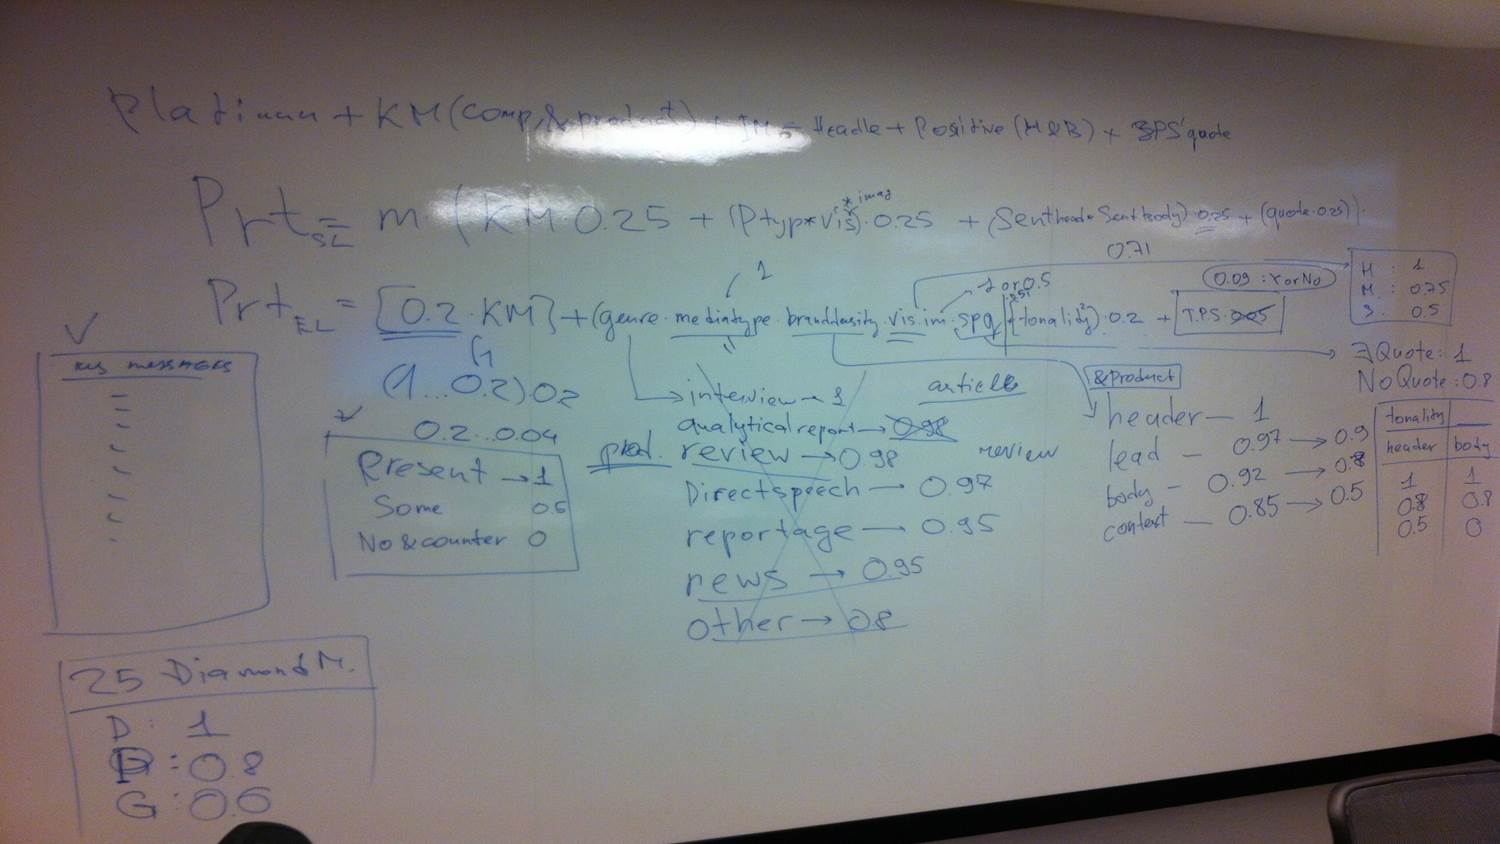
There are five key factors that were taken into consideration when we were constructing this composite index (the name and the approach is borrowed from econometrics, so don’t be surprised if you find this familiar):
- Key message penetration
- Media quality
- Visibility
- Tonality
- Third-party endorsement
These factors can be combined, depending on the goal of the measurement process. In our case, we needed to assess the penetration of product messages, visibility of the article, and thir-party endorsement, so, for practicality reasons, we have combined the media quality, visibility and tonality into one compound multiplier which we named a quality factor (that’s my personal phantom reminiscence from my physics’ past).
Nota bene: we wanted to create an exceptionally simple and practical model. So our approach was less academic and more practical.
If you’re a math-minded person, you’d ask here — did you multiply the factors or sum them up?
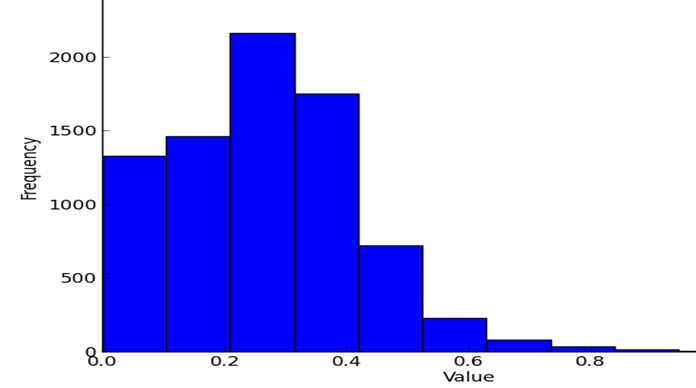
Well, for an index that scales from 0 to 1, we were summing up the three components that measured what’s important for us: the presence of key product or brand messages, media quality (multiplied by visibility and tonality), and thir-party quote. Within each group there were subfactors, for example, we differentiated the tonality of the header and main body tonality, took into account the context of focus mention of the brand, presence of an image (for print and online publications). And these subfactors were not binary — we assigned the initial weights and ran the simulation: a simple Python script that emulates all possible variants and builds the frequency distribution, which was analyzed in R. Then we ran the formula on an array of real publications and measured the starting median index value, against which we began to benchmark our PR results starting mid-2014.
Special thanks: to Yuliya Yudina for letting us do this project, Alejandro Arango for his support and Ex Libris analytical agency for their help with monitoring the media publications and testing the proposed index on the array of real publications.