Assessing the impact of protection from web miners

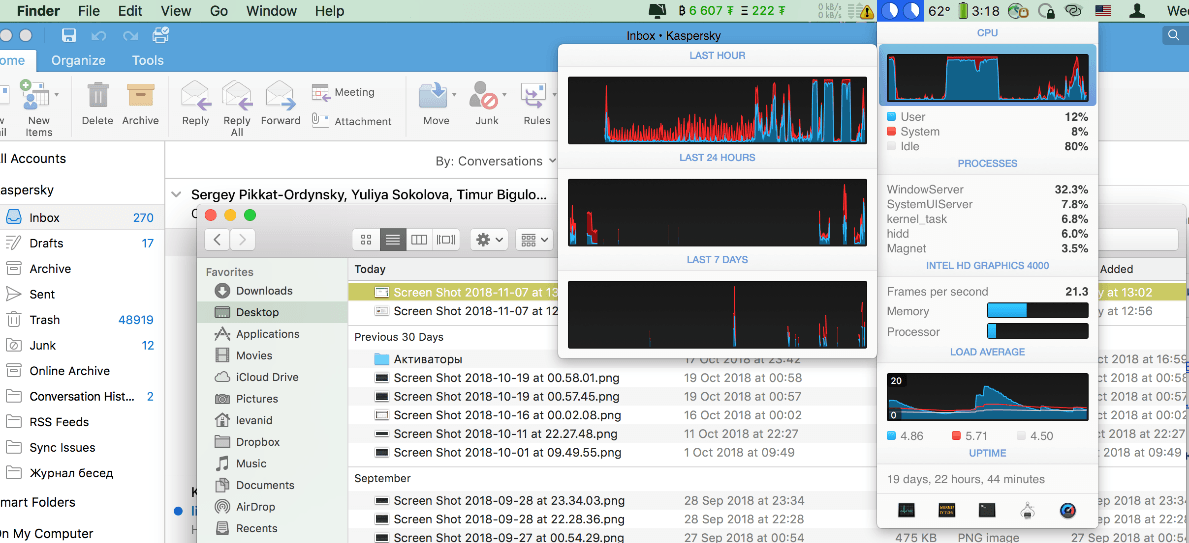
CPU load under Mac OS

Thousands of dollars and tons of CO2

Excerpt of an original publication by Sergey Lurye on September 17, 2019.

Brief summary:

We evaluated the positive economic and environmental impact of blocking web miners with Kaspersky products. The total power saving can be calculated with known accuracy using the formula <w>·N, where <w> is the average value of the increase in power consumption of the user device during web mining, and N is the number of blocked attempts according to Kaspersky Security Network (KSN) data for 2018. This figure is equal to 18.8±11.8 gigawatts (GW), which is twice the average power consumption rate of all Bitcoin miners in that same year. To assess the amount of saved energy based on this power consumption rate, this number is multiplied by the average time that user devices spend on web mining, that is, according to the formula <w>·N·t, where t is the average time that web miners would have been working had they not been blocked by our products. Since this value cannot be obtained from Kaspersky data, we used information from open sources provided by third-party researchers, according to which the estimated amount of electricity saved by users of our products ranges from 240 to 1,670 megawatt hours (MWh). Using the average prices for individual consumers, this amount of electricity could cost up to 200 thousand dollars for residents in North America or up to 250 thousand euros for residents in Europe. Or amount up to 800 of CO2 emission, if you prefer that kind of comparison.

So what’s the Kaspersky contribution to the fight against excess energy consumption?

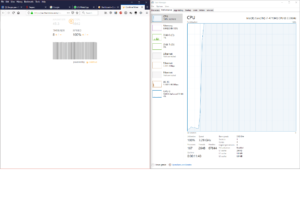
CPU load when mining Monero under Windows

Cryptocurrency mining is an energy-intensive business. According to some estimates, Bitcoin miners consume the same amount of energy as the Czech Republic, a country of more than 10 million people (around 67 Terawatt-hours per year). At the same time, as we already noted, they do this with multiple redundancy — but only as long as this is economically justified. But what about users that are forced to mine against their will — that is, systems affected by web miners (websites mining cryptocurrency)? Since this most often happens illicitly, such sites are detected by security solutions as malicious and blocked.

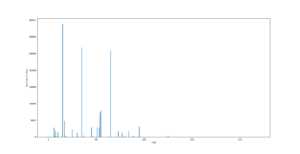
TDP distribution of CPUs in Kaspersky Security Network

In 2018, Kaspersky products blocked 470 million attempts to download scripts and attempts to connect to mining resources on the computers and devices participating in Kaspersky Security Network. Is it possible to assess the economic (and environmental) impact of this undoubtedly positive activity? To answer this question, we had to tackle several issues: assess the increase in electricity consumption due to web mining (spoiler — it’s nearly equal to TDP), estimate the TDP distribution of CPUs in Kaspersky Security Network, and make a wild guess at how much time the web mining could have lasted if such attempts hadn’t been blocked.

Read the full article at Securelist.com or download the .pdf (1.2 MBytes).

Trojan watch: the cyberphysical risks of wearable gadgets

Smart watch spying experiment

We continue to research how proliferation of IoT devices affects the daily lives of users and their information security. In our previous study, we touched upon ways of intercepting authentication data using single-board microcomputers. This time, we turned out attention to wearable devices: smartwatches and fitness trackers. Or more precisely, the accelerometers and gyroscopes inside them.

A reprint from the original publication on Securelist from May 29, 2018.

From the hoo-ha surrounding Strava, we already know that even impersonal data on user physical activity can make public what should be non-public information. But at the individual level, the risks are far worse: these smart devices are able to track the moments you’re entering a PIN code in an ATM, signing into a service, or unlocking a smartphone.

In our study, we examined how analyzing signals within wearable devices creates opportunities for potential intruders. The findings were less than encouraging: although looking at the signals from embedded sensors we investigated cannot (yet) emulate “traditional” keyloggers, this can be used to build a behavioral profile of users and detect the entry of critical data. Such profiling can happen discreetly using legitimate apps that run directly on the device itself. This broadens the capacity for cybercriminals to penetrate victims’ privacy and facilitates access to the corporate network of the company where they work.

So, first things first.

Behavioral profiling of users

When people hear the phrase ‘smart wearables’, they most probably think of miniature digital gadgets. However, it is important to understand that most smartwatches are cyberphysical systems, since they are equipped with sensors to measure acceleration (accelerometers) and rotation (gyroscopes). These are inexpensive miniature microcircuits that frequently contain magnetic field sensors (magnetometers) as well. What can be discovered about the user if the signals from these sensors are continuously logged? More than the owner of the gadget would like.

For the purpose of our study, we wrote a fairly simple app based on Google’s reference code and carried out some neat experiments with the Huawei Watch (first generation), Kingwear KW88, and PYiALCY X200 smartwatches based on the Android Wear 2.5 and Android 5.1 for Smartwatch operating systems. These watches were chosen for their availability and the simplicity of writing apps for them (we assume that exploiting the embedded gyroscope and accelerometer in iOS would follow a similar path).

Smart watch spying experiment

Logging smartwatch signals during password entry

To determine the optimal sampling frequency of the sensors, we conducted a series of tests with different devices, starting with low-power models (in terms of processor) such as the Arduino 101 and Xiaomi Mi Band 2. However, the sensor sampling and data transfer rates were unsatisfactory — to obtain cross-correlation values that were more or less satisfactory required a sampling frequency of at least 50 Hz. We also rejected sampling rates greater than 100 Hz: 8 Kbytes of data per second might not be that much, but not for hours-long logs. As a result, our app sampled the embedded sensors with a frequency of 100 Hz and logged the instantaneous values of the accelerometer and gyroscope readings along three axes (x, y, z) in the phone’s memory.

Admittedly, getting a “digital snapshot” of a whole day isn’t that easy, because the Huawei watch’s battery life in this mode is no more than six hours.

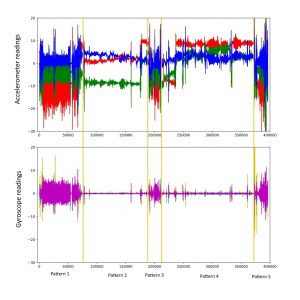
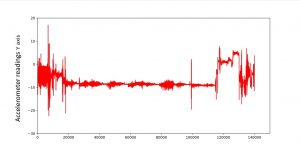
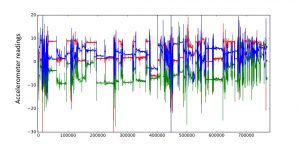
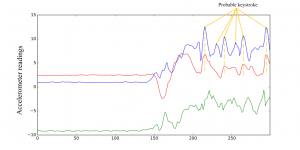
But let’s take a look at the accelerometer readings for this period. The vertical axis shows the acceleration in m/s2, and the horizontal the number of samples (each corresponds to 10 milliseconds on average). For a complete picture, the accelerometer and gyroscope readings are presented in the graphs below.

Accelerometer signal patterns

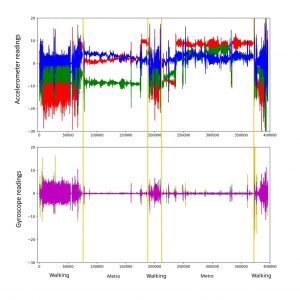
Digital profile of a user recorded in one hour. Top — accelerometer signals, bottom — gyroscope signals

The graphs contains five areas in which different patterns are clearly visible. For those versed in kinematics, this graph tells a lot about the user.

The most obvious motion pattern is walking. We’ll start with that.

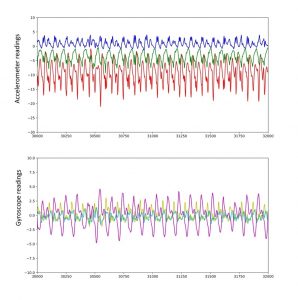
When the user is walking, the hand wearing the smartwatch oscillates like a pendulum. Pendulum swings are a periodic process. Therefore, if there are areas on the graph where the acceleration or orientation readings from the motion sensor vary according to the law of periodicity, it can be assumed that the user was walking at that moment. When analyzing the data, it is worth considering the accelerometer and gyroscope readings as a whole.

Let’s take a closer look at the areas with the greatest oscillations over short time intervals (the purple areas Pattern1, Pattern3, and Pattern5).

Accelerometer and gyroscope signal pattern while walking

Accelerometer and gyroscope readings during walking

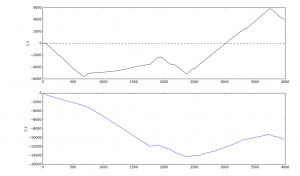
In our case, periodic oscillations of the hand were observed for a duration of 12 minutes (Pattern1, figure above). Without requesting geoinformation, it’s difficult to say exactly where the user was going, although a double numerical integration of the acceleration data shows with an accuracy up to the integration constants (initial velocity and coordinates) that the person was walking somewhere, and with varying characteristic velocity.

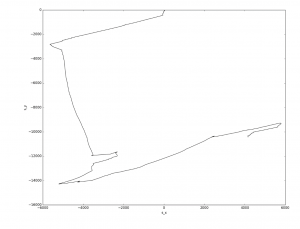
 Numerical integration of accelerometer signals for axes X and Y

Result of the numerical integration of the accelerometer data, which gives an estimate of the user’s movement along the x and y axes in the space of one hour (z-axis displacement is zero, so the graph does not show it)

Note that plotting the Y-axis displacement relative to the X-axis displacement gives the person’s approximate path. The distances here are not overly precise, but they are in the order of thousands of meters, which is actually quite impressive, because the method is very primitive. To refine the distance traveled, anthropometric data can be used to estimate the length of each step (which is basically what fitness trackers do), but we shall not include this in our study.

Visualization of user's path as derived from numerical integration of accelerometer signals

Approximate path of the person under observation, determined on the basis of numerically integrating the accelerometer data along the X and Y axes

It is more difficult to analyze the less active areas. Clearly, the person was at rest during these periods. The orientation of the watch does not change, and there is acceleration, which suggests that the person is moving by car (or elevator).

Another 22-minute segment is shown below. This is clearly not walking — there are no observable periodic oscillations of the signal. However, we see a periodic change in the acceleration signal envelope along one axis. It might be a means of public transport that moves in a straight line, but with stops. What is it? Some sort of public transportation?

Accelerometer data during public transportation

Accelerometer data when traveling on public transport

Here’s another time slice.

An unusual pattern of accelerometer data

Pattern 3, accelerometer data

This seems to be a mixture of short periods of walking (for a few seconds), pauses, and abrupt hand movements. The person is presumably indoors.

Below we interpret all the areas on the graph.

Accelerometer data, interpreted

Accelerometer and gyroscope readings with decoding of areas

These are three periods of walking (12, 3, and 5 minutes) interspersed with subway journeys (20 and 24 minutes). The short walking interval has some particular characteristics, since it involved changing from one subway line to another. These features are clearly visible, but our interest was in determining them using algorithms that can be executed on the wearable devices themselves. Therefore, instead of neural networks (which we know to be great at this kind of task), we used a simple cross-correlation calculation.

Taking two walking patterns (Walking1 and Walking2), we calculated their cross-correlation with each other and the cross-correlation with noise data using 10-second signal data arrays.

         Function
Experiment
max (cor) Ax max (cor) Ay max (cor) Az max (cor) Wx max (cor) Wy max (cor) Wz
Walking1 and Walking2 0.73 0.70 0.64 0.62 0.41 0.83
Walking1 and Noise 0.33 0.30 0.32 0.30 0.33 0.33

Maxima of the functions for cross-correlation of walking patterns with each other and with an arbitrary noise pattern

It can be seen from the table that even this elementary approach for calculating cross-correlation functions allows us to identify the user’s movement patterns within his/her “digital snapshot” with an accuracy of up to 83% (given a very rough interpretation of the correlation). This indicator may not seem that high, but it should be stressed that we did not optimize the sample size and did not use more complex algorithms, for example, principle component analysis, which is assumed to work quite well in determining the characteristic parts of the signal log.

What does this provide to the potential attackers? Having identified the user’s movements in the subway, and knowing the characteristic directions of such movement, we can determine which subway line the user is traveling on. Sure, it would be much easier having data about the orientation of the X and Y axes in space, which could be obtained using a magnetometer. Unfortunately, however, the strong electromagnetic pickup from the electric motors, the low accuracy of determining a northerly direction, and the relatively few magnetometers in smartwatches forced us to abandon this idea.

Without data on the orientation of the X and Y axes in space (most likely, different for individual periods), the problem of decoding the motion trajectory becomes a geometric task of overlaying time slices of known length onto the terrain map. Again, placing ourselves in the attacker’s shoes, we would look for the magnetic field bursts indicate the acceleration/deceleration of an electric train (or tram or trolleybus), which can provide additional information allowing us to work out the number of interim points in the time slices of interest to us. But this too is outside the scope of our study.

Cyberphysical interception of critical data

But what does this all reveal about the user’s behavior? More than a bit, it turns out. It is possible to determine when the user arrives at work, signs into a company computer, unlocks his or her phone, etc. Comparing data on the subject’s movement with the coordinates, we can pinpoint the moments when they visited a bank and entered a PIN code at an ATM.

PIN codes

How easy is it to capture a PIN code from accelerometer and gyroscope signals from a smartwatch worn on the wrist? We asked four volunteers to enter personal PINs at a real ATM.

Accelerometer signals while entering ATM PIN

Accelerometer signals when entering a PIN code on an ATM keypad

Jumping slightly ahead, it’s not so simple to intercept an unencrypted PIN code from sensor readings by elementary means. However, this section of the “accelerometer log” gives away certain information — for example, the first half of the graph shows that the hand is in a horizontal position, while the oscillating values in the second half indicate keys being pressed on the ATM keypad. With neural networks, signals from the three axes of the accelerometer and gyroscope can be used to decipher the PIN code of a random person with a minimum accuracy of 80% (according to colleagues from Stevens Institute of Technology). The disadvantage of such an attack is that the computing power of smartwatches is not yet sufficient to implement a neural network; however, it is quite feasible to identify this pattern using a simple cross-correlation calculation and then transfer the data to a more powerful machine for decoding. Which is what we did, in fact.

         Function
Experiment
max (cor) Ax max (cor) Ay max (cor) Az max (cor) Wx max (cor) Wy max (cor) Wz
One person and different tries 0.79 0.87 0.73 0.82 0.51 0.81

Maxima of the functions for cross-correlation of PIN entry data at an ATM

Roughly interpreting these results, it is possible to claim 87% accuracy in recovering the PIN entry pattern from the general flow of signal traffic. Not bad.

Passwords and unlock codes

Besides trips to the ATM, we were interested in two more scenarios in which a smartwatch can undermine user security: entering computer passwords and unlocking smartphones. We already knew the answer (for computers and phones) using a neural network, of course, but we still wanted to explore first-hand, so to speak, the risks of wearing a smartwatch.

Sure, capturing a password entered manually on a computer requires the person to wear a smartwatch on both wrists, which is an unlikely scenario. And although, theoretically, dictionaries could be used to recover semantically meaningful text from one-handed signals, it won’t help if the password is sufficiently strong. But, again, the main danger here is less about the actual recovery of the password from sensor signals than the ease of detecting when it is being entered. Let’s consider these scenarios in detail.

We asked four people to enter the same 13-character password on a computer 20 times. Similarly, we conducted an experiment in which two participants unlocked an LG Nexus 5X smartphone four times each with a 4-digit key. We also logged the movements of each participant when emulating “normal” behavior, especially in chat rooms. At the end of the experiment, we synchronized the time of the readings, cutting out superfluous signals.

In total, 480 discrete functions were obtained for all sensor axes. Each of them contains 250-350 readings, depending on the time taken to enter the password or arbitrary data (approximately three seconds).

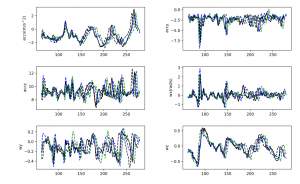
Accelerometer and gyroscope signals while entering keyphrase

Signal along the accelerometer and gyroscope axes for four attempts by one person to enter one password on a desktop computer

To the naked eye, the resulting graphs are almost identical; the extremes coincide, partly because the password and mode of entry were identical in all attempts. This means that the digital fingerprints produced by one and the same person are very similar to each other.

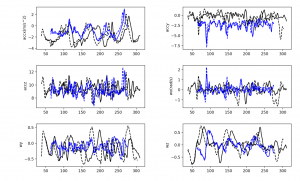
 Accelerometer and gyroscope signals while entering keyphrase, different persons

Signals along the accelerometer and gyroscope axes for attempts to enter the same password by different people on a desktop computer

When overlaying the signals received from different people, it can be seen that, although the passphrase is the same, it is entered differently, and even visually the extremes do not coincide!

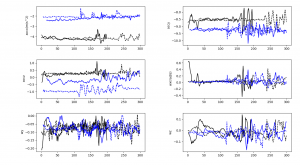
Accelerometer and gyroscope data while unblocking the smartphones

Attempts to enter a smartphone unlock code by two different people

It is a similar story with mobile phones. Moreover, the accelerometer captures the moments when the screen is tapped with the thumb, from which the key length can be readily determined.

But the eye can be deceived. Statistics, on the other hand, are harder to hoodwink. We started with the simplest and most obvious method of calculating the cross-correlation functions for the password entry attempts by one person and for those by different people.

The table shows the maxima of the functions for cross-correlation of data for the corresponding axes of the accelerometer and gyroscope.

         Function
Experiment
max (cor) Ax max (cor) Ay max (cor) Az max (cor) Wx max (cor) Wy max (cor) Wz
One person 0.92 0.63 0.71 0.55 0.76 0.96
Different persons 0.65 0.35 0.31 0.23 0.37 0.76

Maxima of the functions for cross-correlation of password input data entered by different people on a desktop computer

Broadly speaking, it follows that even a very simple cross-correlation calculation can identify a person with up to 96% accuracy! If we compare the maxima of the cross-correlation function for signals from different people in arbitrary text input mode, the correlation maximum does not exceed 44%.

         Function
Experiment
max (cor) Ax max (cor) Ay max (cor) Az max (cor) Wx max (cor) Wy max (cor) Wz
One person and different activity 0.32 0.27 0.39 0.26 0.30 0.44

Maxima of the functions for cross-correlation of data for different activities (password entry vs. usual surfing)

         Function
Experiment
max (cor) Ax max (cor) Ay max (cor) Az max (cor) Wx max (cor) Wy max (cor) Wz
One person 0.64 0.47 0.56 0.41 0.30 0.58
Different persons 0.33 0.40 0.40 0.32 0.38 0.34

Maxima of the functions for cross-correlation of data for an unlock code entered by one person and by different people

Note that the smallest cross-correlation function values were obtained for entering the smartphone unlock code (up to 64%), and the largest (up to 96%) for entering the computer password. This is to be expected, since the hand movements and corresponding acceleration (linear and angular) are minimal in the case of unlocking.

However, we note once more that the computing power available to a smartwatch is sufficient to calculate the correlation function, which means that a smart wearable gadget can perform this task by itself!

Conclusions

Speaking from the information security point of view, we can conclude that, without a doubt, portable cyberphysical systems expand the attack surface for potential intruders. That said, the main danger lies not in the direct interception of input data — that is quite difficult (the most successful results are achieved using neural networks) and thus far the accuracy leaves much to be desired. It lies instead in the profiling of users’ physical behavior based on signals from embedded sensors. Being “smart,” such devices are able to start and stop logging information from sensors not only through external commands, but on the occurrence of certain events or the fulfillment of certain conditions.

The recorded signals can be transmitted by the phone to the attacker’s server whenever the latter has access to the Internet. So an unassuming fitness app or a new watch face from the Google Play store can be used against you, right now in fact. The situation is compounded by the fact that, in addition to this app, simply sending your geotag once and requesting the email address linked to your Google Play account is enough to determine, based on your movements, who you are, where you’ve been, your smartphone usage, and when you entered a PIN at an ATM.

We found that extracting data from traffic likely to correspond to a password or other sensitive information (name, surname, email address) is a fairly straightforward task. Applying the full power of available recognition algorithms to these data on a PC or in cloud services, attackers, as shown earlier, can subsequently recover this sensitive information from accelerometer and gyroscope signal logs. Moreover, the accumulation of these signals over an extended period facilitates the tracking of user movements — and that’s without geoinformation services (such as GPS/GLONASS, or base station signals).

We established that the use of simple methods of analyzing signals from embedded sensors such as accelerometers and gyroscopes makes it possible (even with the computing power of a wearable device) to determine the moments when one and the same text is entered (for example, authentication data) to an accuracy of up to 96% for desktop computers and up to 64% for mobile devices. The latter accuracy could be improved by writing more complex algorithms for processing the signals received, but we intentionally applied the most basic mathematical toolbox. Considering that we viewed this experiment through the prism of the threat to corporate users, the results obtained for the desktop computer are a major cause for concern.

A probable scenario involving the use of wearable devices relates to downloading a legitimate app to a smartwatch — for example, a fitness tracker that periodically sends data packets of several dozen kilobytes in size to a server (for example, the uncompressed “signal signature” for the 13-character password was about 48 kilobytes).

Since the apps themselves are legitimate, we assume that, alongside our Android Wear/Android for Smartwatch test case, this scenario can be applied to Apple smartwatches, too.

Recommendations

There are several indications that an app downloaded onto a smartwatch might not be safe.

  1. If, for instance, the app sends a request for data about the user’s account (the GET_ACCOUNTS permission in Android), this is cause for concern, since cybercriminals need to match the “digital fingerprint” with its owner. However, the app can also allow the user to register by providing an email address — but in this case you are at least free to enter an address different to that of the Google Play account to which your bank card is linked.
  2. If the app additionally requests permission to send geolocation data, your suspicions should be aroused even further. The obvious advice in this situation is not to give additional permissions to fitness trackers that you download onto your smartwatch, and to specify a company email address at the time of registration.
  3. A short battery life can also be a serious cause for concern. If your gadget discharges in just a few hours, this is a sign that you may be under observation. Theoretically, a smartwatch can store logs of your activity with length up to dozens of hours and upload this data later.

In general, we recommend keeping a close eye on smartwatches sported by employees at your office, and perhaps regulating their use in the company’s security policies. We plan to continue our research into cyberphysical systems such as wearable smart gadgets, and the additional risks of using them.

Why it’s too late to #DeleteFacebook

Facebook was recently hit by a huge scandal. According to media reports, data on the “likes” of 50 million Facebook users was harvested by the firm Cambridge Analytica and used for targeted political advertising. Facebook’s own behavior of added fuel to the fire of public outrage.

As a result, the company’s capitalization shed tens of billions of dollars (it’s down $35 billion as we write), and a number of Twitter activists launched the #DeleteFacebook campaign. In our opinion, first, the action comes a bit late —the horse has well and truly bolted — and second, the incident underscores yet again people’s dependence on modern technology and vulnerability to it.

Facebook users' profiles have been for sale for a while

A dime a dozen

Let’s deal with the chronology first. It really began in 2014 with a study by Wu Youyou and Michal Kosinski of Cambridge and Stanford Universities, respectively, along with a coauthor from Stanford University.

As part of the research, participants were asked to create a personality portrait based on the OCEAN model (Openness, Conscientiousness, Extravertism, Agreeableness, Neuroticism), involving downloading the Facebook app MyPersonality, which analyzed their likes. About 86,000 people took part. The authors’ main conclusion was that the Web knows much more about people than people know about themselves. Sure thing, Sherlock.

The results attracted the interest of another Cambridge University professor by the name of Alexander Kogan. Kogan is reported to have asked to see the initial research data, but was declined. It’s not known why — professional ethics, potential legal trouble with Facebook (although officially no rules would have been broken at the time), or academic rivalry. Whatever the case, soon after the exchange, Kogan decided to conduct his own study.

In the meantime, Facebook tightened its privacy settings, making likes inaccessible to third-party apps by default. But then crowdsourcing came to Kogan’s rescue — in the form of Amazon Mechanical Turk, where the app Thisisyourdigitallife was hosted. Users were informed that the app had been created for the purpose of conducting a psychological study, and Kogan was named as the research leader.

The purpose of the research was stated as follows: to study the likes of as many Facebook users as possible and build sociopsychological profiles based on that information. The participants, about 270,000 in all, were paid a dollar each.

There was nothing criminal about the study itself — except perhaps the price tag ($270,000 is quite an outlay for a psychological study, and one doubts that the Cambridge professor paid for it himself).

However, such data is a goldmine for market scientists — and not only those who work for commercial companies, but also those in political parties. The idea that political figures are marketable like consumer goods to the masses (based on target group preferences) has been around since Stanley Milgram began conducting his renowned sociopsychological experiments.

Milgram is remembered today for, among other things, his revelations about the interconnectedness of North Americans. It’s likely Milgram thought the development of technology would bring us ever closer together. But even he could not have imagined that, having obtained data on hundreds of thousands of people, research commissioners would be able to up that figure to hundreds of times greater (according to the latest accusations against Cambridge Analytica) than the original number of respondents.

That was because in handing over information about their likes, research participants simultaneously also gave away their Facebook friends’ likes, raising the count to over 50 million.

How did Cambridge Analytica wind up with 50 million profiles?

How Kogan’s guinea pigs became the property of a firm in Cambridge is another murky tale. Cambridge Analytica is a subsidiary of a communications company, SCL (Strategic Communications Laboratories), which specializes in data processing.

The details vary depending on the source: Some say Kogan was a cofounder of SCL, others that he was only a research operator hired by the firm. Commercial companies outsource sociological and psychological research to universities — it’s standard practice. However, in such cases, universities (almost) never hand over the personal data of their research participants to the commissioners of the study — only faceless statistics.

According to Facebook’s version of events, as soon as the company became aware, back in 2015, that SCL/Cambridge Analytica was in possession of user data, the social media giant immediately requested its deletion. But Facebook’s response failed to convince doubters; hence the snowballing #DeleteFacebook campaign.

The story is multifaceted, it must be said. For a start, there’s a strong whiff of academic rivalry — the desire of researchers to outdo each other in terms of sample size. Then, there’s the likelihood that the user agreement with the participants was violated — they were probably (and their Facebook friends were certainly) not informed that their data would be given to third parties. Lastly, there are the dubious actions of Facebook itself.

What do Facebook users have to do with all this?

For us users, it’s another wake-up call. How many more incidents will it take before people finally smell the coffee and realize that their social media presence affects not only them, but also those they interact with? And when apps like GetContact, MyPersonality, and Thisisyourdigitallife are making the rounds, think twice before clicking.

But the social media genie is out of the bottle and there’s no putting it back. Calling on people to delete themselves from social media is no less belated than announcing the termination of contracts with an analytics company two full years after everything that might have happened already did.

According to our data, 78% of users would quite like to kick the social media habit, but they feel they can’t. For 62% of them, it’s just too convenient a tool for keeping in touch with friends and family. What’s more, many have no inkling of how much information (videos, photos, messages) they’ve published out there on social media, including, of course, on Facebook.

Reprinted from Kaspersky Lab’s Kaspersky Daily blog.

50 hashes per hour

Raspberry Pi Zero

How a harmless-looking insider can compromise your network

How often do you turn off your computer when you go home from work? We bet you leave it on so you don’t have to wait until it boots up in the morning. It’s possible that your IT staff have trained you to lock your system for security reasons whenever you leave your workplace. But locking your system won’t save your computer from a new type of attack that is steadily gaining popularity on Raspberry Pi enthusiast forums.

We previously investigated the security of charging a smartphone via a USB port connection. In this research we’ll be revisiting the USB port – this time in attempts to intercept user authentication data on the system that a microcomputer is connected to. As we discovered, this type of attack successfully allows an intruder to retrieve user authentication data – even when the targeted system is locked. It also makes it possible to get hold of administrator credentials. Remember Carbanak, the great bank robbery of 2015, when criminals were able to steal up to a billion dollars? Finding and retrieving the credentials of users with administrative privileges was an important part of that robbery scheme.

In our research we will show that stealing administrator credentials is possible by briefly connecting a microcomputer via USB to any computer within the corporate perimeter. By credentials in this blogpost we mean the user name and password hash and we won’t go into detail how to decipher the retrieved hash, or how to use it in the pass-the-has types of attacks. What we’re emphasizing is that the hardware cost of such an attack is no more than $20 and it can be carried out by a person without any specific skills or qualifications. All that’s needed is physical access to corporate computers. For example, it could be a cleaner who is asked to plug “this thing” into any computer that’s not turned off.

Insider doesn't have to be very qualified

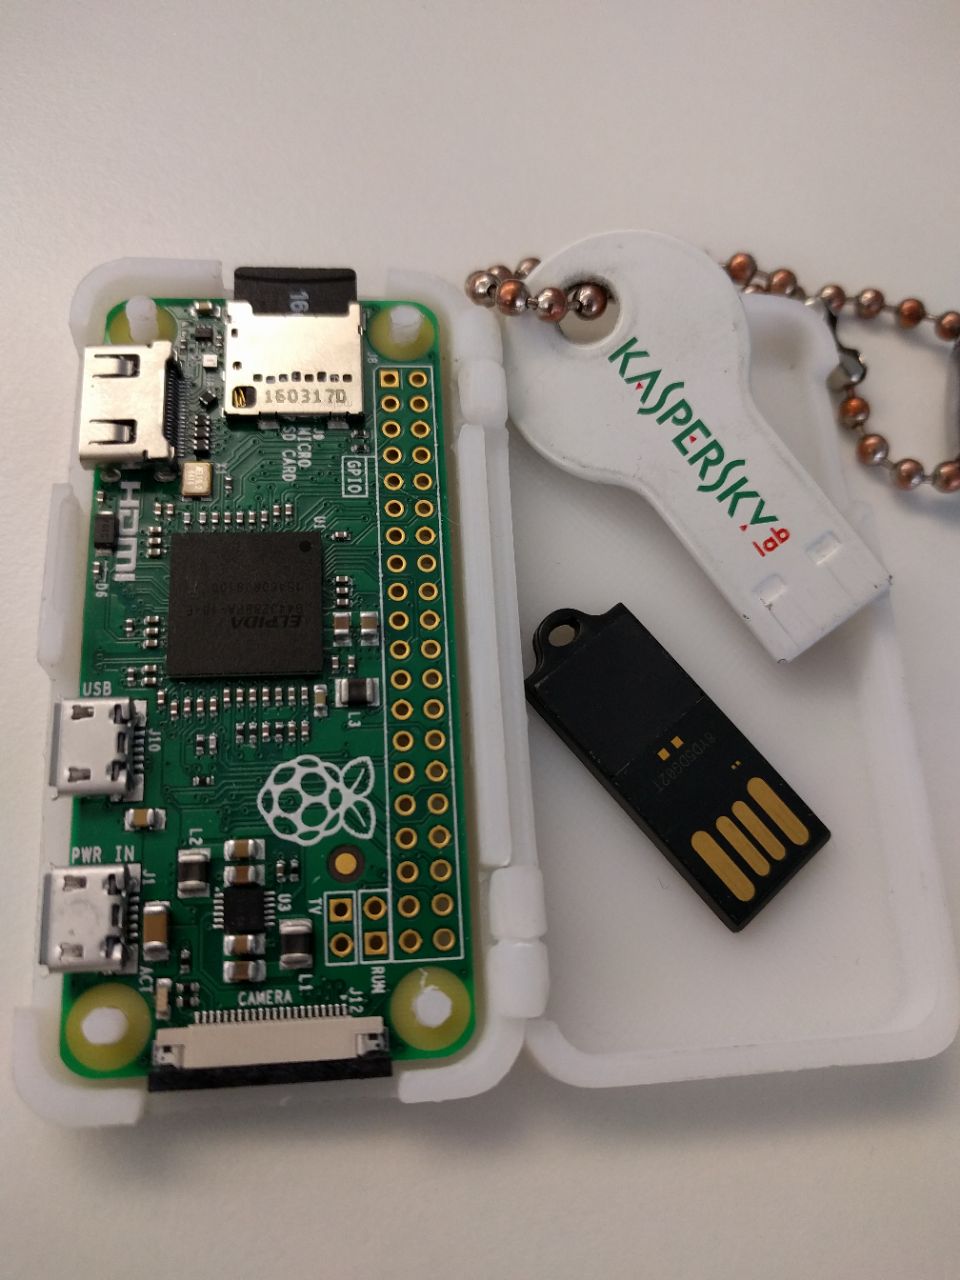
We used a Raspberry Pi Zero in our experiments. It was configured to enumerate itself as an Ethernet adapter on the system it was being plugged into. This choice was dictated by the popularity of Raspberry Pi Zero mentions on forums where enthusiasts discuss the possibility of breaking into information systems with single-board computers. This popularity is understandable, given the device capabilities, size and price. Its developers were able to crank the chip and interfaces into a package that is slightly larger than an ordinary USB flash drive.
Raspberry Pi Zero

Yes, the idea of using microcomputers to intercept and analyze network packets or even as a universal penetration testing platform is nothing new. Most known miniature computing devices are built on ARM microprocessors, and there is a special build of Kali Linux that is specifically developed for pen testing purposes.

There are specialized computing sticks that are designed specifically for pen testing purposes, for example, USB Armory. However, with all its benefits, like integrated USB Type A connector (Raspberry Pi requires an adapter), USB Armory costs much more (around $135) and absolutely pales in comparison when you look at its availability vs. Raspberry Pi Zero. Claims that Raspberry Pi can be used to steal hashes when connected via USB to a PC or Mac surfaced back in 2016. Soon there were claims that Raspberry Pi Zero could also be used for stealing cookies fromh3 browsers – something we also decided to investigate.

So, armed with one of the most widespread and available microcomputers at the moment, we conducted two series of experiments. In the first, we attempted to intercept user credentials within the corporate network, trying to connect to laptop and desktop computers running different operating systems. In the second, we attempted to retrieve cookies in a bid to restore the user session on a popular website.

Experiment 1: stealing domain credentials

Methodology

The key principle behind this attack is emulation of the network adapter. We had absolutely no difficulties in finding the module emulating the Ethernet adapter under Raspbian OS (for reference, at the time of writing, we hadn’t found a similar module for Kali Linux). We made a few configuration changes in the cmdline.txt and config.txt files to load the module on boot.

cmdline.txt

config.txt

A few extra steps included installing the python interpreter, sqlite3 database library and a special app called Responder for packet sniffing:

apt-get install -y python git python-pip python-dev screen sqlite3
pip install pycrypto
git clone
https://github.com/spiderlabs/responder

And that wasn’t all – we set up our own DHCP server where we defined the range of IP addresses and a mask for a subnet to separate it from the network we’re going to peer into. The last steps included configuring the usb0 interface and automatic loading of Responder and DHCP server on boot. Now we were ready to rock.

Results

Just as soon as we connected our “charged” microcomputer to Windows 10, we saw that the connected Raspberry Pi was identified as a wired LAN connection. The Network Settings dialogue shows this adapter as Remote NDIS Internet sharing device. And it’s automatically assigned a higher priority than others.
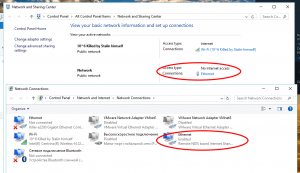
A fake network adapter is displayed

Responder scans the packets that flow through the emulated network and, upon seeing the username/password hash pairs, directs them to a fake HTTP/HTTPS/NTLM (it supports v1 and v2) server. The attack is triggered every time applications, including those running in the background, send authentication data, or when a user enters them in the standard dialogue windows in the web browser – for example, when user attempts to connect to a shared folder or printer.

Standard authentication window

Intercepting the hash in automatic mode, which is effective even if the system is locked, only works if the computer has another active local network connection.

As stated above, we tried this proof of concept in three scenarios:

  1. Against a corporate computer logged into a domain
  2. Against a corporate computer on a public network
  3. Against a home computer

In the first scenario we found that the device managed to intercept not only the packets from the system it’s connected to via USB but also NTLM authentication requests from other corporate network users in the domain. We mapped the number of intercepted hashes against the time elapsed, which is shown in the graph below:

Playing around with our “blackbox” for a few minutes, we got proof that the longer the device is connected, the more user hashes it extracts from the network. Extrapolating the “experimental” data, we can conclude that the number of hashes it can extract in our setting is around 50 hashes per hour. Of course, the real numbers depend on the network topology, namely, the amount of users within one segment, and their activity. We didn’t risk running the experiment for longer than half an hour because we also stumbled on some peculiar side effects, which we will describe in a few moments.

The extracted hashes are stored in a plain-text file:
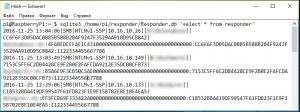
Hashes in the plaintext file

In the second scenario we were only able to extract the connected system’s user credentials: domain/Windows name and password hash. We might have gotten more if we had set up shared network resources which users could try to access, but we’re going to leave that outside the scope of this research.

In the third scenario, we could only get the credentials of the owner of the system, which wasn’t connect to a domain authentication service. Again, we assume that setting up shared network resources and allowing other users to connect to them could lead to results similar to those we observed in the corporate network.

The described method of intercepting the hashes worked on Mac OS, too. When we tried to reach an intranet site which requires entering a domain name, we saw this dialogue warning that the security certificate is invalid.

Certificate warning

Now, the interesting side effect we mentioned above was that when the device was connected to a[ny] system in the network, tasks sent out to the network printer from other machines in the same network were put on hold in the printer queue. When the user attempted to enter the credentials in the authentication dialogue window, the queue didn’t clear. That’s because these credentials didn’t reach the network printer, landing in the Raspberry Pi’s flash memory instead. Similar behavior was observed when trying to connect to remote folders via the SMB protocol from a Mac system.

Network printing error

Bonus: Raspberry Pi Zero vs. Raspberry Pi 3

Once we saw that the NTLM systems of both Windows and Mac had come under attack from the microcomputer, we decided to try it against Linux. Furthermore, we decided to attack the Raspberry Pi itself, since Raspbian OS is built on the Debian Weezy core.

We reproduced the experiment, this time targeting Raspberry Pi 3 (by the way, connecting it to the corporate network was a challenging task in itself, but doable, so we won’t focus on it here). And here we had a pleasant surprise – Raspbian OS resisted assigning the higher priority to a USB device network, always choosing the built-in Ethernet as default. In this case, the Responder app was active, but could do nothing because packets didn’t flow through the device. When we manually removed the built-in Ethernet connection, the picture was similar to that we had observed previously with Windows.
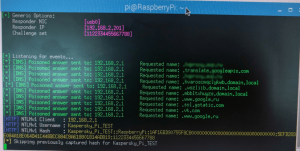
Raspberry Pi Zero hacking into Raspberry Pi 3

Similar behavior was observed on the desktop version of Debian running on Chromebook – the system doesn’t automatically set the USB Ethernet adapter as default. Therefore, if we connect Raspberry Pi Zero to a system running Debian, the attack will fail. And we don’t think that creating Raspberry Pi-in-the-middle attacks is likely to take off, because they are much harder to implement and much easier to detect.

Experiment 2: stealing cookies

Methodology

While working on the first experiment, we heard claims that it’s possible to steal cookies from a PC when a Raspberry Pi Zero is connected to it via USB. We found an app called HackPi, a variant of PoisonTap (an XSS JavaScript) with Responder, which we described above.

The microcomputer in this experiment was configured just like in the previous one. HackPi works even better at establishing itself as a network adapter because it has an enhanced mechanism of desktop OS discovery: it is able to automatically install the network device driver on Windows 7/8/10, Mac and –nix operating systems. While in the first series of experiments, an attack could fail on Windows 7, 8 or Vista if the Remote NDIS Internet sharing device didn’t install itself automatically (especially when the PC is locked). And, unlike in the previous series, HackPi never had trouble assigning itself the default network adapter priority under Mac OS either.

What differs from the first experiment is that the cookies are stolen using the malicious Java Script launched from the locally stored web page. If successful, PoisonTap’s script saves the cookies intercepted from sites, a list of which is also locally stored.

Results

If the computer is not locked and the user opens the browser, Java Script initiates the redirecting of web requests to a malicious local web page. Then the browser opens the websites from the previously defined list. It is indeed quite spectacular:

Poisontap stealing cookies

If the user does nothing, Raspberry Pi Zero launches the default browser with URL go.microsoft.com in the address line after a short timeout. Then the process goes ahead as described. However, if the default browser has no cookies in the browser history, the attackers gain nothing.

Among the sites we’ve seen in the list supplied with the script were youtube.com, google.com, vk.com, facebook.com, twitter.com, yandex.ru, mail.ru and over 100 other web addresses. This is what the log of stolen cookies looks like:
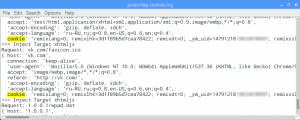
Cookies in the plaintext

We checked the validity of stolen cookies using the pikabu.ru website as an example by pasting the info into a clean browser field on other machines and were able to get hold of the user’s account along with all the statistics. On another website belonging to a railroad company vending service, we were able to retrieve the user’s token and take over the user’s account on another computer, because authentication protocol used only one LtpaToken2 for session identification.
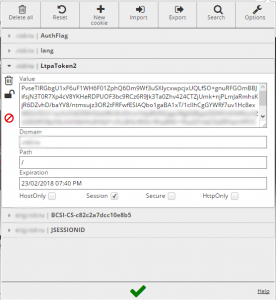
Session restored using stolen cookies

Now this is more serious, because in this case the criminals can get information about previous orders made by the victim, part of their passport number, name, date of birth, email and phone number.
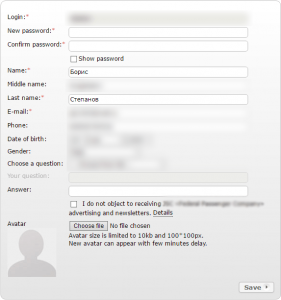
Session restored using stolen cookies

One of the strong points of this attack is that enthusiasts have learned how to automatically install the network device driver on all systems found in today’s corporate environments: Windows 7/8/10, Mac OS X. However, this scenario doesn’t work against a locked system – at least, for now. But we don’t think you should become too complacent; we assume it’s only a matter of time before the enthusiasts overcome this as well. Especially given that the number of these enthusiasts is growing every day.

Also, the malicious web page is blocked by all Kaspersky Lab products, which detect it as Trojan.JS.Poisontap.a. We also assume that this malicious web page will be blocked by the products of all other major anti-malware vendors.
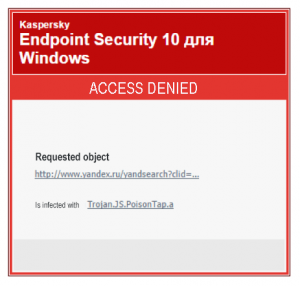
Malicious code blocked by security solution


Conclusions

There is already a wide array of single-board microcomputers: from the cheap and universal Raspberry Pi Zero to computing sticks specifically tuned for penetration testing, which cannot be visually differentiated from USB flash drives. To answer the main question of just how serious this threat is, we can say that at the moment it is overrated. However, we don’t advise underestimating the capabilities of IoT enthusiasts and it’s better to assume that those obstacles which we discovered in our experiment, have already been overcome.

Right now we can say that Windows PCs are the systems most prone to attacks aimed at intercepting the authentication name and password with a USB-connected Raspberry Pi. The attack works even if the user doesn’t have local or system administrator privileges, and can retrieve the domain credentials of other users, including those with administrator privileges. And it works against Mac OS systems, too.
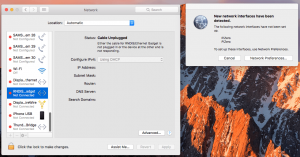
MacOS is vulnerable, too

The second type of attack that steals cookies only works (so far) when the system is unlocked, which reduces the chances of success. It also redirects traffic to a malicious page, which is easily blocked by a security solution. And, of course, stolen cookies are only useful on those websites that don’t employ a strict HTTP transport policy.

Recommendations

However, there are a number of recommendations we’d like to give you to avoid becoming easy prey for attackers.

Users

1. Never leave your system unlocked, especially when you need to leave your computer for a moment and you are in a public place.

2. On returning to your computer, check to see if there are any extra USB devices sticking out of your ports. See a flash drive, or something that looks like a flash drive? If you didn’t stick it in, we suggest you remove it immediately.

3. Are you being asked to share something via external flash drive? Again, it’s better to make sure that it’s actually a flash drive. Even better – send the file via cloud or email.

4. Make a habit of ending sessions on sites that require authentication. Usually, this means clicking on a “Log out” button.

5. Change passwords regularly – both on your PC and the websites you use frequently. Remember that not all of your favorite websites may use mechanisms to protect against cookie data substitution. You can use specialized password management software for easy management of strong and secure passwords, such as the free Kaspersky Password Manager.

6. Enable two-factor authentication, for example, by requesting login confirmation or with a hardware token.

7. Of course, it’s strongly recommended to install and regularly update a security solution from a proven and trusted vendor.

Administrators

1. If the network topology allows it, we suggest using solely Kerberos protocol for authenticating domain users. If, however, there is a demand for supporting legacy systems with LLNMR and NTLM authentication, we recommend breaking down the network into segments, so that even if one segment is compromised, attackers cannot access the whole network.

2. Restrict privileged domain users from logging in to the legacy systems, especially domain administrators.

3. Domain user passwords should be changed regularly. If, for whatever reason, the organization’s policy does not involve regular password changes, please change the policy. Like, yesterday.

4. All of the computers within a corporate network have to be protected with security solutions and regular updates should be ensured.

5. In order to prevent the connection of unauthorized USB devices, it can be useful to activate a Device Control feature, available in the Kaspersky Endpoint Security for Business suite.

6. If you own the web resource, we recommend activating the HSTS (HTTP strict transport security) which prevents switching from HTTPS to HTTP protocol and spoofing the credentials from a stolen cookie.

7. If possible, disable the listening mode and activate the Client (AP) isolation setting in Wi-Fi routers and switches, disabling them from listening to other workstations’ traffic.

8. Activate the DHCP Snooping setting to protect corporate network users from capturing their DHCP requests by fake DHCP servers.

Last, but not least, you never know if your credentials have been leaked from a site you’ve been to before – online or physical. Thus, we strongly recommend that you check your credentials on the HaveIbeenPwned website to be sure.

Reposted from Securelist.

Happy New Quantum Year

Happy New Quantum Year

If you’ve been our faithful reader and your memory has not been damaged by digital amnesia, you may remember that one of the key insights from Kaspersky Security Bulletin 2015 was a forecast that cryptography as a discipline is on the verge of subdual by quantum computing as a result of progress in bringing the latter to reality. To be honest, I personally thought this forecast a bit ahead of its time, especially being in the part of our bulletin called “Predictions for 2016,” but recent headlines changed my mind.

Happy New Quantum Year

Quantum news

In the span of just a few weeks in late November and December 2016, we learned that Microsoft is hiring top-notch quantum computing scientists and Intel is hinting about its plans to transform silicon chips into quantum processors that can host millions of qubits (quantum bits — units of quantum information). Such processors can be quite useful for building, for example, an AI based on a neural network of quantum computing devices, the proof-of-concept of which has been reported by researchers from Japan’s Tohoku University. And in early January, news arrived that D-Wave, arguably the world’s best known quantum computing pioneer, is open-sourcing quantum computing software.

In other words, quantum computing is evolving faster than I expected. What does this mean for us, the average users? Does it mean, for example, that we’ll be able to go to a store and buy a “qMac” by the end of the year?

Well, not exactly. Apart from D-Wave, it’s really hard to name another university spin-off that has been able to get far on the bumpy road from laboratory to commercialization. Debates are ongoing about how “really quantum” D-Wave’s device is. I won’t go into that in detail, leaving room for you to read through my colleague’s previous post or read this amazing piece.

Apparently quantum computing is not yet a commodity — as computers became in the 1980s and 90s by the efforts of IBM, Apple, Microsoft, and many others. The complexity and price of quantum computing devices make them better analogous to mainframes, which started to emerge much earlier, in the 1950s.

In the middle of the past century, the biggest obstacle to adoption of the new technology wasn’t the hardware itself; it was the ability to take full advantage of the versatility of the new computing paradigm, which required decades of research. More than three decades of technology development were required before the industry could unveil in the late 1970s all of the building blocks necessary for the emergence of personal computers — and another three decades for PCs to become a basis of modern civilization.

Quantum revolution is nigh

History doesn’t repeat itself, but it often rhymes. Although an important step toward widening the community of quantum computing enthusiasts, D’Wave’s opening of the qbsolve to the developer community is not at all like the emergence of Intel’s x86 architecture or IBM’s PC platform. It actually could have rhymed with Alan Turing’s fundamental works of the 1930s, which laid out the basics of “machine cognition” — that is, if it hadn’t come eight months after IBM’s announcement of the IBM Quantum Experience, which, in my personal opinion, does a much better job of explaining what quantum computing is and how it can be used practically.

I must confess, I was so charmed by IBM that I am thinking of asking for trial access to their quantum processor to test if hash-breaking tasks can be performed with it quicker than with an average system’s CPU or GPU. To add more to my admiration, IBM is a company that is going to witness a second major computing paradigm shift within its lifetime. Nevertheless, given the disparity in the amount of available resources, open-sourcing the software is the right direction for D-Wave to go in the wake of intensifying competition in this market.

As we’ve seen from the headlines, Intel is not planning to miss the quantum revolution, and neither is Microsoft. Those old friends from the 1980s actually have a long history of cooperating with researchers exploring superconducting spin qubits. Few details are available about Intel’s plans, but if the company succeeds in adding the spin qubits to the existing silicon chip designs, that’s going to be a game changer in terms of qubit density.

However, it seems that Intel’s quantum chips, as well as D-Wave’s, still need cooling to the temperature of liquid helium (−452 °F and below). That means a smartphone-grade QPU would need to be housed in a mainframe-size facility. In other words, quantum computing power is not yet meant for personal use.

Quantum means “much faster”

The simplest way to explain the game change in processing power is to make an analogy with parallel computing. Qubit states are a superposition of conventional “0” and “1,” the amount of which is limited only to the resolving power of the system, so it is fair to some extent to say that information stored in qubits is processed simultaneously. Which means that a quantum processing unit will be some orders of magnitude more powerful than traditional CPU.

Well, the analogy is not perfect, given that quantum computation operations are not exactly the same as basic operations used in digital algebra, but it seems that quantum computing scientists will need some time to take full advantage of the new computing paradigm, just as it took decades with digital.

However, the main question is, what should we do with this humongous computing power? It doesn’t appear that we need all of the flops hidden in today’s gadgets to perform our most common user tasks, despite the effort developers have put into their apps to make them as multimedia as possible.

Well, think again. Have you seen a message from your favorite messaging app letting you know that it now encrypts all conversations? Or, perhaps, you’ve heard about cryptocurrencies —Bitcoin being the most known — or about blockchain technology? Yes, I am talking about cryptography and technologies that are built upon it.

With 2016 a record-high in terms of the amount of information leaks, encryption is becoming a necessity, not just in the corporate sector, where it is now enforced with even more strength, but for consumers as well. Encryption and decryption tasks consume a lot of computing power. So does the bitcoin mining process. Other implementations of blockchain technology may perform cryptography functions on specialized nodes with more computing power available to them. In fact, bitcoin mining is already nearly ineffective on casual PCs — that’s why specialized mining farms are built. But such initiatives, such as building a more secure IoT (Internet of Things) upon blockchain, lead me to the conclusion that encryption is going to be ubiquitous.

Postquantum cryptography

And guess what? Cryptography is the kind of task for which quantum computers are going to be especially good.

Quantum computing may bring either salvation or doom to this emerging new world. As we said in our Security Bulletin in 2015, cryptography the way it exists today will definitely lead to doom. The thesis that “cryptography is one of the very few fields where adversarial conflict continues to heavily favor the defender” will be strongly contested (to say the least) until effective postquantum cryptography algorithms are introduced.

Those, in turn, may require much more computing power than conventional computers are ready to yield. But, to our salvation, the miniaturization and commoditization of quantum computer devices is also imminent, which means that there will be more computing power available to defend against attackers. And the never-ending game of attackers vs. defenders will continue on a new level.

Apart from our information security discourse, we still have hope that advances in quantum computing will further boost augmented reality, virtual reality, artificial intelligence, and other resource-hungry applications.

To sum up: Quantum computers appear to be inching closer to reality. You still can’t touch one, but it’s good to see that there are computing platforms for quantum computers that you can check for yourself with IBM or D-Wave. That checking requires a certain level of geekiness, so the majority of Earth’s population still have to wait. But with more big names like Intel, IBM, Google, and Microsoft pouring money into the effort, it seems inevitable that we’ll see at least some practical outcome.

We’ve also heard rumors that Google may unveil a breakthrough before the end of 2017, so we may not have to wait for long…

Originally published at Kaspersky Lab’s Daily blog.

Viruses: Back to basics

Do you remember where the term “virus” came from? Yes, I’m talking about biological viruses, after which IT security specialists named the computer programs that insert their own code into other objects to reproduce and propagate themselves.

It is very likely that soon this information technology term will regain its original meaning — researchers from Microsoft and the University of Washington have marked a new milestone in data storage by writing approximately 200MB of data in the form of a synthetic DNA.

dna-storage-featured

You may ask: What’s the connection with biological viruses? The analogy is pretty direct — viruses insert their genetic code into the DNA of infected organisms, causing the DNA to reproduce the viruses instead of synthesizing the right proteins, which are vital.

The most aggressive viruses disrupt normal physiological processes to such an extreme extent that it leads to the death of the cells and, in the end — of the whole organism. Similarly, the most aggressive malware may render the infected information system absolutely useless, or “dead.”

Therefore, now that humankind has begun writing information in the form of the DNA, it may be worth starting to worry about protecting this data at the “hardware level.” But first, let me give you an overview of how this “hardware” works.

Inside DNA

DNA, which stands for deoxyribonucleic acid, is the largest molecule in our organism, and a carrier of genetic information. The closest IT analogue is the boot image, which enables the computer to start up and load the operating system. In most cases (with some exceptions I won’t touch in this post), after the operating system has been loaded into memory, the computer launches the executable modules required to support itself and perform the work it’s programmed to do. In the same manner, living cells in most cases use DNA to produce the “executables” — RNA (ribonucleic acids) sequences, which handle protein synthesis to sustain the organism and perform its functions.

All characteristics of the organism, from eye and hair color to any hereditary disorders, are stored in the DNA. They are encoded in a sequence of nucleotides — molecular blocks containing (for most known organisms) only four varieties of nitrogenous bases: adenine, guanine, thymine, and cytosine. These can be called “biological bits.” As you can see, mother nature has used a quaternary numeral system to encode genetic information, unlike human-made computers, which use binary code.

It’s worth mentioning that DNA has a built-in code correction function — most known DNA has two strands of nucleotides, wrapped one around another like a twisted-pair wire in a double helix.

These two strands are attached one to another with hydrogen bonds that form only between strictly defined pairs of nucleotides — when they complement each other. This ensures that information encoded into a given sequence of nucleotides in one strand corresponds to a similar sequence of complementary nucleotides in the second strand. That’s how this code-correction mechanism works — when decoded or copied, the first DNA strand is used as a source of data and the second is used as a control sequence. This indicates if a sequence of nucleotides, coding some genetic characteristic, has been damaged in one of the strands.

In addition, genetic characteristics are encoded into nucleotide sequences using redundant encoding algorithms. To explain how it works in the simplest case — imagine that every hereditary characteristic, written as a sequence of nucleotides, is accompanied by a checksum.

The sequences of nucleotides coding genetic characteristics, or genes, have been studied extensively in the 50 years since the discovery of DNA. Today you can have your DNA read in many labs or even online — via 23andme or similar services.

How scientists read DNA

Through the past few centuries, scientists have developed methods to determine the structure of minuscule objects, such as X-ray structure analysis, mass spectrometry, and a family of spectroscopy methods. They work quite well for molecules comprising two, three, or four atoms, but understanding the experimental results for larger molecules is much more complicated. The more atoms in the molecule, the harder it is to understand its structure.

Keep in mind that DNA is considered the largest molecule for a good reason: DNA from a haploid human cell contains about 3 billion pairs of bases. The molecular mass of a DNA is a few orders of magnitude higher than the molecular mass of the largest known protein.

In short, it’s a huge heap of atoms, so deciphering experimental data obtained with classical methods, even with today’s supercomputers, can easily take months or even years.

But scientists have come up with a sequencing method that rapidly accelerates the process. The main idea behind it: split the long sequence of bases into many shorter fragments that can be analyzed in parallel.

To do this, biologists use molecular machines: special proteins (enzymes) called polymerases. The core function of these proteins is to copy the DNA by running along the strand and building a replica from bases.

But we don’t need a complete copy of the DNA; instead, we want to split it into fragments, and we do that by adding the so-called primers and markers — compounds that tell the polymerase where to start and where to stop the cloning process, respectively.

Primers contain a given sequence of nucleotides that can attach itself to a DNA strand at a place where it finds a corresponding sequence of complementary bases. Polymerase finds the primer and starts cloning the sequence, taking the building blocks from the solution. Like every living process, all of this happens in a liquid form. Polymerase clones the sequence until it encounters a marker: a modified nucleotide that ends the process of building the strand further.

There is a problem, however. The polymerase, DNA strand, primers, markers, and our building blocks, all are dispersed in the solution. It’s therefore impossible to define the exact location where polymerase will start. We can define only the sequences from which and to which we’re going to copy.

Continuing to the IT analogy, we can illustrate it in the following manner. Imagine that our DNA is a combination of bits: 1101100001010111010010111. If we use 0000 as a primer and 11 as a marker, we will get the following set of fragments, placed in the order of decreasing probability:
0000101011,
00001010111,
0000101011101001011,
00001010111010010111.

Using different primers and markers, we will go through all of the possible shorter sequences, and then infer the longer sequence based on the knowledge of what it is composed of.

That may sound counterintuitive and complicated, but it works. In fact, because we have multiple processes in parallel, this method reaches quite a good speed. That is, a few hours compared with months or years — not very fast from IT perspective, though.

DNA and random access

After learning how to read DNA, scientists learned how to synthesize sequences of nucleotides. The Microsoft researchers were not the first to try writing information in the form of artificial DNA. A few years ago, researchers from EMBL-EBI were able to encode 739 kilobytes.

Two things make Microsoft’s work a breakthrough. First, the researchers have greatly increased the stored data volume, to 200MB. That’s not too far from the 750MB of data that is contained in every strand of human DNA.

However, what is really new here is that they have proposed a way of reading part of the DNA, approximately 100 bases (bio-bits) long, in each sequencing operation.

The researchers were able to achieve that by using pairs of primers and markers that enable them to read a certain set of nucleotides with a defined offset from the beginning of the strand. It’s not exactly the random access to a single bit, but the technology is close — block memory access.

Researchers believe that the main niche for such DNA memory could be high-density long-term memory modules. It definitely makes sense: the best known samples of flash memory provide a density of ~1016 bits per cubic centimeter, whereas the estimated density for DNA memory is three orders of magnitude higher: ~1019 bits per cubic centimeter.

At the same time, DNA is quite a stable molecule. Coupled with built-in redundant coding and error-correction schemes, data on it would remain readable years or even centuries after it being written.

Back to viruses

But what does it all mean from an information security standpoint? It means that the integrity of information stored in such a way may be threatened by organisms that have specialized in data corruption for billions of years — viruses.

We’re unlikely to see a boom of genetically modified viruses created to hunt coded synthetic DNA. It will simply be easier — for a long time — to modify data and insert malicious code when the data is digital, before it’s written to DNA.

But it’s an open question, how to protect such data from corruption by existing viruses. Polymerase will gladly replicate any DNA in the solution: for example, the DNA of the common flu virus.

So it may be worth noting if anyone was sneezing or coughing while you were writing an important file…


A repost from https://blog.kaspersky.com/dna-storage/13563/. Please include the original link when sharing.

Surges in mobile energy consumption during USB charging and data exchange

Recently, our colleagues questioned the security of charging mobile devices via USB ports. They discovered that if there were a computer behind the port, there would be a data exchange, even when the mobile is blocked. We became curious – is it possible to measure the energy consumption of the “host + mobile” system during handshakes? Also, is it possible to estimate the impact on energy consumption when we separate the charging process from data exchange using the Pure.Charger device?

As it turned out, it wasn’t too hard to measure energy consumption – all it takes is a commercially available multimeter, preferably, with serial connection to a computer, which would allow you to analyze logs in a convenient manner. It was possible to provide a rough estimate of how much energy is dissipated during handshakes and to estimate to a known degree of certainty the amount of energy required to send one bit of data over the USB connection.

A little bit of theory

Dissipation of electrical energy into heat is due to two key reasons, the first being the imperfection of even the most modern computers and the second being the irreversibility of classic (non-quantum) computing.

The fundamental limit on energy consumption can be estimated using Landauer’s principle, first introduced in 1961: ∂Q = dS · T = kTln(2), which is equal to roughly 3×10-21 Joules (J) at room temperature. In reality, computation and, especially, data transfer is much more energy-hungry. We learned from a 2014 review by Coroama and Hilty, published in Environmental Impact Assessment Review, that it takes approximately 4×10⁻⁷ Joules per bit to transfer data over the Internet. That is 14 orders of magnitude above the fundamental limit.

Unfortunately, we haven’t been able to find similarly thorough and high-quality reports on energy consumption during USB data transfer. So, we decided to perform our own experiment.

Experiment

We have used various combinations of host systems and mobiles.

Notebooks Operating System
Apple MacBook Pro OS X 10.10.5
Dell Latitude E6320 Windows 7 64-bit Enterprise Edition

To which we’ve been connecting these mobile phones:

Mobile device Platform
Samsung GT-i9300 (Galaxy S3) Android 4.4
LG Nexus 6X Android 6.0.1
Apple iPhone 4s iOS 9.2.1

The choice of mobiles was dictated by the fact that Android 6 mobiles behave themselves differently than smartphones on earlier versions of Android. They have a built-in protection from USB data transfer, enabling “charge-only” mode by default upon connection to a USB port. However, since we already knew from the previous research that a handshake, nonetheless, occurs in this setting, too, we wanted to check the energy consumption of phones during handshakes. We also wanted to discover the difference in behavior of mobiles based on different versions of Android and iOS.

electro_lurye_pic01

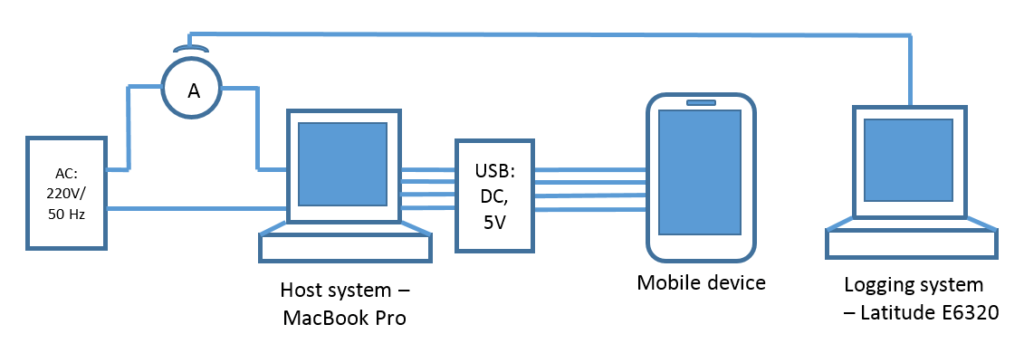
Diagram of the experiment set-up in the MacBook Pro experiment

electro_lurye_pic02

Experimental set-up in the Dell Latitude E6320 experiment

Our simple experiment, in essence, was to measure the current flowing through the wire that connects the system, which comprises a host, a connected mobile, and a power outlet. We designed this experiment in such a way, on one hand, to ensure the reproducibility of its results and, on the other hand, to avoid damaging the computer’s power adapter. Thus, we also tested the stability of the frequency and voltage of the alternating current and saw no dependence of these two parameters from the data exchange.

Since the multimeter provided us with RMS (root mean square) values of the alternating current within finite time intervals, the amount of consumed energy can be approximated by a sum of products of current IRMS average value of voltage URMS and time interval duration δt. We have used the RMS values of current in all our calculations instead of amplitude (I0 = IRMS *√2), because, by definition, the RMS value is equivalent to a value of DC current that dissipates the same amount of heat on the same resistive load.

Results

Handshakes

In order to exclude the charging current’s influence on multimeter readings, the mobiles and laptops which we used as host computers, were fully charged. Furthermore, we used a Pure.Charger device, which allows us to turn the USB data lines on and off as desired. The sequence was the following: first we connected the Pure.Charger to the host computer’s USB port and then we introduced the mobile device to Pure.Charger’s output USB port. By doing so, we effectively separated the moment of connection to the USB port and the moment when data lines were enabled.

In the graph below you can see the consumption current dynamics (in mA) when a Nexus 5X was connected to a MacBook Pro host:

electro_lurye_pic03

Here we see two distinct peaks of current, first when the phone is connected to a data line in “charge-only” mode, and second – when the MTP mode is enabled.

Current consumption dynamics for the connection of an unblocked Samsung S3 looks like this:

electro_lurye_pic04

Here we see a single large consumption peak – because the phone is not blocked, it starts an MTP session right after it’s connected to the port.

The graph below we obtained with an iPhone 4S and a Latitude E6320 with the same settings:

electro_lurye_pic05

The main consumption peak, due to the handshake between the Latitude E6320 and iPhone 4S, is preceded by a smaller spike, which corresponds to a handshake between the Latitude E6320 and Pure.Charger. As the amount of energy consumed during the handshake is proportional to the area below the curve, it can be seen that the amount of energy consumed due to the handshake of the host with Pure.Charger is significantly lower that the amount consumed due to the handshake with the iPhone 4S.

The experiment with the Latitude E6320 and iPhone 4S is the only one where Pure.Charger’s handshake is clearly seen – it is not distinctly observed in other experiments. The Pure.Charger’s consumption current, as obtained in the series of the experiments, does not exceed the idle current standard deviation for both the MacBook and the Latitude E6320.

The value of current fluctuations in the Latitude E6320 experiment (standard deviation was equal to 7-8 mA) was greater than current fluctuations in the MacBook experiment (standard deviation was equal to 4 mA). There are two reasons for this. Firstly, the Latitude E6320 was built using HDD and the MacBook Pro that we used was built using SSD. Secondly, in the corresponding experiment the Latitude E6320 was used both as a host and as a logging system.

Data transfer

In order to learn more about how much energy is required to send a unit of data over a USB connection, we had the hosts and the mobiles transfer files of a specified size to one another.

Fixed amount of data

The dynamics of the consumption current, in mA, for the Nexus 5X that was tasked with transferring 391 MB of data to the MacBook host, looked like this:

electro_lurye_pic06

Here we observe the same two consumption peaks specific to an Android 6-based device, and an increase in the average consumption current during data transfer.

This is how the consumption current depends on time in an experiment where the MacBook Pro was reading 188 MB of data from Samsung S3:

electro_lurye_pic07

Here we see a sharp single peak corresponding to a handshake with Samsung S3, a distinct start and finish of file transfer with increased consumption current, and a small spike in the current when the phone is disconnected, which is due to the system closing processes and windows which were active when the phone was connected.

We have carried out multiple similar experiments. As expected, the time interval elapsed for file transfer, was dependant on the file size – the larger the file, the longer it takes to send it through the USB channel.

Energy consumption dependence on the direction of data transfer

Does energy consumption depend on the direction of data transfer? We set up an experiment during which a group of files of the same size was sent to the host from the mobile, and vice versa, and measured the system’s consumption current. Because it’s impossible to send the files directly to an iOS-based mobile, this experiment was performed only with Android-based systems.

electro_lurye_pic08 electro_lurye_pic09

The left-hand graph shows the consumption current dynamics (in mA) when the Latitude E6320 is connected to the Samsung S3 and reads 808 MB of data. The graph on the right shows the current consumption when the Latitude E6320 sends the same amount of information to the Samsung S3. Despite the noise specific to the Latitude E6320 series of experiments, the moments of file transfer start and finish are seen clearly.
We carried out six similar experiments and came to the following conclusions:

  1. The average value of consumption current while sending data from the host to the mobile is lower, and this decrease is greater than the standard error.
  2. Meanwhile, the time elapsed for sending the file from a host to a mobile is longer than the time elapsed for receiving the same-sized file by a host from a mobile. This time interval increase is roughly the same as the decrease in average consumption current.

Taking into account that the voltage was the same, the energy consumption can be estimated as a product of voltage times average current and times the length of the time interval. The estimated values of energy consumption for data transfer from mobile to host and from host to mobile were effectively in the same confidence interval.

Energy consumption per unit of information

In order to approximate the dependence of consumed energy on the size of data we made two assumptions:

  1. The amount of energy required to transfer a unit of data depends only on the type of host and mobile.
  2. The amount of energy required to transfer a known amount of data is directly proportional to the size of data sent. This assumptions is probably not correct, because communication systems, and USB in particular, are optimized for sending data in bulk, thus the smaller the amount, the less energy is required to transfer it. However, there are accompanying computational processes that don’t go away. Therefore, it would be more accurate to approximate this dependence with a power function with fractional index. But the difference between linear approximation and such a power function would be significant for smaller amounts of data.

Under these assumptions, we have estimated that the most energy-efficient pair is the MacBook Pro connected with the Samsung S3 – they dissipate only (3.3±0.2)x10-8 Joules per bit, and the most power-hungry combination was the Latitude E6320 with the iPhone 4S, which dissipated (9.8±0.6)x10-8 Joules per bit.

electro_lurye_pic10

Conclusions

The amount of energy required to transfer a unit of information through the USB channel is within the range of 3.1×10⁻⁸ to 1.4×10⁻⁷ Joules per bit. Remember the article we cited in the beginning? Their assessment (for transfer of Internet data) was 4×10⁻⁷ Joules per bit, which means that our assessment for USB connections is within the same order of magnitude.

Still, there are two more things to consider for further research. First, data transfer during handshakes is different from file transfer as it involves more computational processes and thus leads to greater consumption of system energy. Second, the dependence of energy consumption on the size of transferred data is presumably not quite linear, and for better accuracy should be approximated with a convex function. A better approximation requires more data points and more pairs of hosts and mobiles to be investigated.

Economy of scale

To sum it all up, I’d like to estimate the ratio of energy consumption caused by handshakes to the energy that is consumed while charging a mobile device. A typical charge on a 2 A current would last 20 to 40 minutes, which means that a mobile receives anywhere from 12 to 24 kJ of energy when charging. Therefore, blocking the handshakes that waste a few to dozens of Joules, allows for saving tenths to hundredths of a percent of this energy. A single user would not even notice this effect, but if all the folks living in New York used a Pure.Charger, they would save a whopping 33 Kilowatt-hours of electricity every day! To give you an idea of how much this is – Tesla electric cars can drive over 100 miles on this charge. This may not look like a big deal for a mega polis, but it’s a noticeable effect, isn’t it?

We will continue to research the physical characteristics of mobile devices during data exchange, both from a security perspective and in search of more data points. We welcome readers to reproduce this experiment themselves and report their findings!

This material uses experimental results submitted for publication in IEEE Transactions on Mobile Computing. The preprint is available here.

Reprinted from SecureList.com

Catch the Wave! Scientists have finally detected gravitational waves


“…A long time ago, in a galaxy far, far away…

Two black holes subdued to the gravitational pull and coalesced into a single entity. While coalescing, they violently rippled the space-time surface and on 14th September, 2015, these ripples reached planet Earth and were successfully recorded and deciphered.”

SL1

This is how the official press conference on the detection of gravitational waves by LIGO and VIRGO international scientific collaborations began in the University of Glasgow yesterday. The importance of this discovery cannot be overestimated. Many titans of modern science fit the discovery of gravitational waves into the same level of importance as observation of Higgs boson. There is a strong reason for that. The existence of gravitational waves was predicted right after the key postulates of the General Relativity Theory were published by Einstein. While studying the energy radiation processes during supernovae, neutron stars formation and collapses (stars turning into black holes), astrophysicists concluded many times that a significant portion of energy was radiated in a form of gravitational waves. So a lot of scientific effort was put into experimentally detecting gravitational waves in many countries all over the globe. There were claims of signal coming above the noise from time time, but all failed to either reproduce the results or correlate them with astrophysical calculations and other astronomical data. For example, when Earth saw the supernova in the Large Magellanic Cloud in 1987, a group from Rome claimed that they had registered the gravitational signal, but the claimed signal shape was a total mismatch with the data from astronomy, and as a result, they had to admit that their experiment’s methodology was flawed.

This is due to the fact that gravity is the weakest interaction known to science today. To discover the gravitational wave either a very sensitive detector is required, or an extreme astronomy event has to happen – and, preferably, not too far from Earth.

That’s why in 1992 the work was started on LIGO (Laser Interferometer Gravitational Observatory), the concept of which had been proposed by Kip Thorn, now known to the world as the producer of the “Interstellar” movie. The corresponding international collaboration involved scientists from all over the world, including Russia. Initially, the LIGO project included two detectors, one in Louisiana and another – in Washington. Another observatory, named VIRGO, was later constructed in Italy, near Pisa – so that scientists could not just confirm the detection, but also triangulate the signal and detect the source. In a short while, all scientists joined their effort in LSC (LIGO Scientific Collaboration), crafting extremely sophisticated scientific and engineering complexes. Thousands of people were committed to making this happen and hundreds of PhDs were defended, including mine. To illustrate the complexity – these facilities are able to record the relative movement of the so called probe masses with precision of meters 10-19 – four orders of magnitude lower than the size of most elements’ nuclei.

And finally, on 14th September 2015, LIGO scientists were able to detect the signal, distinctly above the noise level. A few months were required to decipher and check the findings together with theorists, and in January the scientists filed a paper to Physical Review Letters, published on 11th February 2016. There are hundreds of co-authors of this paper from 133 international research institutions, including Moscow State University. So I am proud to congratulate all the people who have taken part in this decades-long endeavor!

SL2

P.S. Many people ask about the practical use of gravitational waves. At the moment, it’s a hard question, especially in light of the complexity of facilities and monstrosity of computational effort required to decipher them. But let’s remember how humanity had encountered radio waves a century ago – their practical use wasn’t clear from the beginning either. The discovery of gravitational waves puts an end to the decades-long argument about the nature of gravity (which started as soon as the General Relativity Theory was formulated) and provides hope that the united field theory will finally see the light. That might include the agreement between theorists on the version of the quantum field gravity theory. But, anyway, there is hope that one day humans will learn how to generate gravitational waves – and become able to propel themselves in space in a better way.

Prisoner’s dilemma for information security industry

My friends know that my curiosity leads me to various places of the human knowledge oicumena. This time I was walking across the game theory where I’ve stumbled upon a “Prisoner’s dilemma”. I was struck to see how this dilemma is similar to the situation we have with threat announcements in particular – and with information security industry in general.

But let me explain what a “prisoner’s dilemma” is (for those of you who are not yet familiar with this concept for any reason). Imagine a situation that there are two suspects in custody. One of them (let’s name her Alice) is approached by investigators and asked to testify against the other (let’s name him Bob). In exchange, the officers incentivize her that her sentence will be lowered to one year, while her testimony will make sure that Bob spends three years in prison. Of course, the same offer goes to Bob. But if they both testify, one against the other, they provide so much evidence so both become convicted for a two-year sentence each. To the contrary, if they both refused to testify, they would get a minimal punishment of one year – as prosecutor would have not enough evidence for a longer sentence (*). A matrix of choice is the following:

Sentence (Alice, Bob), in years

Alice

Testifies

Remains silent

Bob

Testifies

Alice – 2 years, Bob – 2 years

Alice – 3 years, Bob – 1 year

Remains silent

Alice – 1 year, Bob – 3 years

Alice – 1 year, Bob – 1 year

So, if Alice and Bob have had no previous agreement about cooperating against the prosecutors, their rational strategy would be to testify against one another – as spending just one year in prison is better than spending three. Thus, they both testify and receive a two-year sentence, while if they both kept silent, they could have received a lesser sentence. The trick is that each actor, A and B, is selfish and does what he or she thinks is best for him or her. And this leads to worse results for the both.

The power of this simple theory is that there are numerous examples of this dilemma happening here and there. In the days of Cold War, NATO and Warsaw Pact countries had a similar dilemma: to arm or to disarm. From each side’s point of view, disarming while their opponent continued to arm would have led to military inferiority and possible annihilation. Conversely, arming when their opponent disarmed would have led to superiority. If both sides chose to arm, neither could afford to attack the other, but the cost of developing and maintaining a nuclear arsenal were huge. If both sides chose to disarm, war would be avoided and there would be no costs. Although the ‘best’ overall outcome is for both sides to disarm – so that economies of the countries in both blocks could flourish, the rational behavior led the both to arm, and this is indeed what happened.

Now, back to information security industry. When we’re trying to sell our products and solutions, we have a dilemma – to generate FUD (fear, uncertainty, doubt) – or not. We are, essentially, in the “arms race” with other security vendors – who generates more FUD, wins more attention and, depending on the monetization skills, gains more revenue. But FUD generation requires effort, money – and, to make things worse, the effect wears off. Common people get used to hearing news about hacks, breaches and other nasty cyber things. Journalists and bloggers are tired, too. Brian Krebs, quoted in this article, said: «I have to admit even I get sick of these stories. At some level you have to ask: ‘Does this breach really matter’?”

And, as with prisoner’s dilemma, the solution is similar: cooperation. How to do it properly – is an open question.

______________________________________________________________________________________

(*) To be precise, this is a description of a non-strict Prisoners’ dilemma, where “selfish” payoff is equal to “cooperated”. In a strict Prisoner’s dilemma setting the payoff for being selfish and testifying against another person in custody has to be greater than payoff of keeping silent. I’ve done this on purpose to illustrate the similarity of the Prisoner’s dilemma to information security industry.

Dark matter – killer of dinosaurs and threat to life on Earth?

What caused the extinction of dinosaurs? This question has been haunting the scientists for a very long time. One of the dominant theories involves our planet’s collision with a massive heavenly body, such as an asteroid or comet, some 65 million years ago. The fact of simultaneous extinction of about 16% of marine and 18% of terrestrial animal families also points the same way. But why of all times did the collision occur at exactly the end of Cretaceous, when the period of intense bombardment of our planet had long ended and explosive development of life began in all its multiple forms? The thing is, in the space beyond the bounds of the Solar System there is a region filled with ice and interstellar material believed (for direct observation of that region has not been made possible yet) to be a home to quite a number of comets and other space objects, which at certain intervals change their trajectories to approach our Earth and other planets.

Oort cloud

This region, which goes under the name of Oort cloud, lies well out of the Solar System, spanning approximately 50 to 100 thousand astronomical units (one unit equals the distance between the Earth and the Sun), which is about a quarter the of distance to Centauri Proxima, the star closest to the Earth. On the whole the cloud is a stable formation – since our planet formed in the geological sense of the term the Earth has not had too many collisions with massive heavenly bodies. The interesting part is, bursts of comet activity have been observed to recur about every 35 million years. Luckily, most of the comets simply fail to reach the Earth surface, torn into pieces by the gravitational fields of the nearby Solar System planets. The individual fragments are not that dangerous, at least on a planetary level. Yet, if you look at the demolition caused by fragments of comet Shoemaker-Levy, which fell on Jupiter in 1994, you will probably agree that a similar cataclysm would have caused very serious consequences for the Earth. But what exactly makes comets leave the Oort cloud and head for the Earth on a convergent trajectory? Two possible explanations have been proposed so far. The first one involves the gravitational pull of an as-yet-undiscovered distant companion star to the Sun. The other involves the oscillations of the gravitational field as the Solar System crosses the disc (plane) of the Milky Way. As has been suggested by Lisa Randall and Matthew Reece of Harvard University in the March issue of Physics World, the gravitational field of only the visible matter of the galactic disc is too small to have much of an effect on the paths of the comets in the Oort cloud.

The true reasons are often hidden from the eye of the observer

In 1933 Fritz Zwicky, an American astronomer of Swiss origin, at the time busy calculating the mass of a galactic cluster in the constellation of Coma by measuring the rotation speed of galaxies (of which there are about 600) – the so called dynamic mass – found he received a value at odds with the one obtained from the luminosity of the stars of the galaxies. The difference was 50-fold! This is how the term “dark matter” came in existence (borrowed by Zwicky from Oort’s work, by the way.) Today astrophysicists believe the visible (that which gives off light) matter to amount to less that one percent of the total mass of the Universe. The dark matter consisting of baryonic (common) material, i.e. planets, stars either defunct or never lit, intergalactic gas, as well as non-baryonic material, i.e. neutrinos and leptons, accounts for another couple of tens of percent. The rest is the so called dark energy, but we shall talk about it later.

The main problem with the dark matter is, it is difficult to detect: electrically neutral, it can only be betrayed by its gravitational pull. Both theory and observations suggest that dark matter mostly concentrates in the halo around our galaxy, much like the Oort cloud around our Solar System. Last year Randall and Reece, together with JiJi Fan and Andrey Katz, hypothesized that some part of the dark matter might partly interact with the common material by exchanging “dark” photons, i.e. the quanta of electromagnetic emission. As a result, the interacting part of the dark matter (about 5% of the total) might form a “shadow” galactic disc in the same plane as our Milky Way. In their work, available as a preprint from arXiv, Randall and Reece show that in the conventional model (common matter in the center, dark matter around the perimeter) the galactic disc has a surface density of about 7 solar masses per square parsec. By comparison, the suggested new model (in which about 5% of the dark matter is in the “shadow” disc) gives the surface density of about 10 solar masses per square parsec, and the “shadow disc” has a thickness of about 10 parsec. Apart from the fact that the new model offers a better understanding of the registered Oort cloud stability fluctuations, such “shadow disc” is quite a realistic catch for the European Space Agency’s Gaia mission. So if the theory is confirmed, the scientific society will be able to better understand the true behavior of comets, including those with power to threaten the existence of life on the Earth.

Source: PhysicsWorld.

Related links: